CoreDump
介绍
linux程序异常退出时,会产生一个core文件,该文件记录了程序运行时的内存,寄存器状态,堆栈指针,内存管理信息还有各种函数调用堆栈信息等,我们可以理解为是程序工作当前状态存储生成的一个文件,通过工具分析这个文件,我们可以定位到程序异常退出的时候对应的堆栈调用等信息,找出问题所在并进行及时解决。
注意
设置core文件生成的目录,其中%e表示程序文件名,%p表示进程ID,否则会在程序的当前目录生成core文件;
先查看当前core文件生成目录,可以进行备份cat /proc/sys/kernel/core_pattern
echo /data/coredump/core.%e.%p >/proc/sys/kernel/core_pattern
当前执行程序的用户对core目录有写权限且有足够的空间存储core文件;
生成不受限制的core文件;ulimit -c unlimited
只有开启-g调试的程序才可以调试coredump信息 gdb program coreDumpFile
进入coredump就如同进入gdb的断点,一切gdb的命令都可用
如果core文件创建失败,要注意生成目录/data/coredump是否有w权限
代码处理
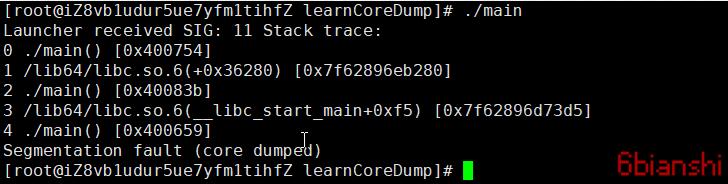
代码处理coreDump相对简单,只需监听coreDump相关的信号,在信号回调打印对应的调用栈信息,但打印的信息相对的看不懂。。
1
2
3
4
5
6
7
8
9
10
11
12
13
14
15
16
17
18
19
20
21
22
23
24
25
26
27
28
29
30
31
32
33
34
35
36
37
38
39
40
41
42
43
44
45
|
#include <stdio.h>
#include <signal.h>
#include <execinfo.h>
#include <stdlib.h>
#define CORE_DUMP_STACK_SIZE 256
void handle_segv(int signum)
{
void *array[CORE_DUMP_STACK_SIZE];
size_t size;
char **strings;
size_t i;
signal(signum, SIG_DFL);
size = backtrace (array, CORE_DUMP_STACK_SIZE);
strings = (char **)backtrace_symbols (array, size);
if (strings == NULL) {
perror("backtrace_symbols");
exit(EXIT_FAILURE);
}
fprintf(stderr,"Launcher received SIG: %d Stack trace:\n", signum);
for (i = 0; i < size; i++)
{
fprintf(stderr,"%d %s \n",i,strings[i]);
}
free (strings);
}
int main()
{
signal(SIGSEGV, handle_segv);
signal(SIGABRT, handle_segv);
int *p = NULL;
*p = 8;
return 0;
}
|
代码coredump
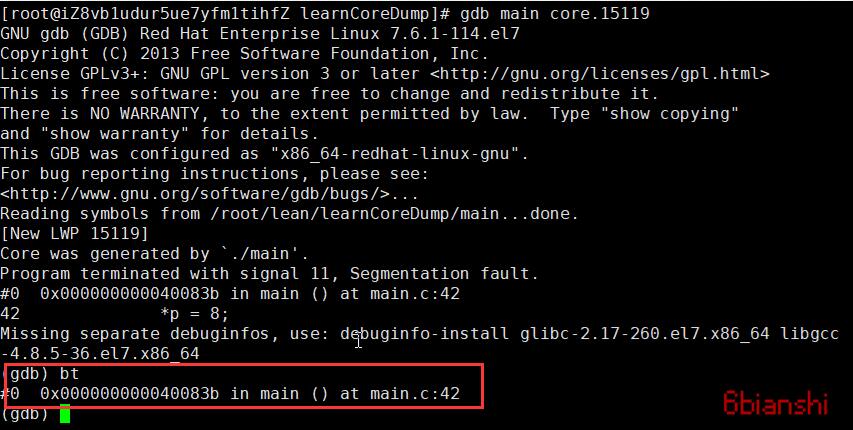
gdb调试coredump
调用堆栈
1
2
3
4
5
6
7
8
9
10
11
12
13
14
15
16
17
18
19
20
21
22
23
24
25
26
27
28
29
30
31
32
33
34
35
36
37
38
39
40
41
42
43
| #include <execinfo .h>
#include <stdio .h>
#include <stdlib .h>
void fun1();
void fun2();
void fun3();
void print_stacktrace();
int main()
{
fun3();
}
void fun1()
{
printf("stackstrace begin:\n");
print_stacktrace();
}
void fun2()
{
fun1();
}
void fun3()
{
fun2();
}
void print_stacktrace()
{
int size = 16;
void * array[16];
int stack_num = backtrace(array, size);
char ** stacktrace = backtrace_symbols(array, stack_num);
for (int i = 0; i < stack_num; ++i)
{
printf("%s\n", stacktrace[i]);
}
free(stacktrace);
}
|
编译与结果1:
1
2
3
4
5
6
7
8
9
10
| ~/work/test$ gcc test.cc -o test1
~/work/test$ ./test1
stackstrace begin:
./test1() [0x400645]
./test1() [0x400607]
./test1() [0x400612]
./test1() [0x40061d]
./test1() [0x4005ed]
/lib/x86_64-linux-gnu/libc.so.6(__libc_start_main+0xff) [0x7f5c59a91eff]
./test1() [0x400529]
|
从上面的运行结果中,我们的确看到了函数的调用栈,但是都是16进制的地址,会有点小小的不爽。当然我们可以通过反汇编得到每个地址对应的函数,但这个还是有点麻烦了。
编译与结果2:
1
2
3
4
5
6
7
8
9
10
| ~/work/test$ gcc test.cc -rdynamic -o test2
~/work/test$ ./test2
stackstrace begin:
./test2(_Z16print_stacktracev+0x26) [0x4008e5]
./test2(_Z4fun1v+0x13) [0x4008a7]
./test2(_Z4fun2v+0x9) [0x4008b2]
./test2(_Z4fun3v+0x9) [0x4008bd]
./test2(main+0x9) [0x40088d]
/lib/x86_64-linux-gnu/libc.so.6(__libc_start_main+0xff) [0x7f9370186eff]
./test2() [0x4007c9]
|
从上面的运行可以看到函数的名字了,对比一下2和1的编译过程,2比1多了一个-rdynamic的选项。
-rdynamic主要作用是让链接器把所有的符号都加入到动态符号表中
同一个函数可以在代码中多个地方调用,如果我们只是知道函数,而不知道在哪里调用的,有时候还是不够方便,可以通过address2line命令来完成。
1
2
3
4
| ~/work/test$ addr2line -a 0x4008a7 -e test2 -f
0x00000000004008a7
_Z4fun1v
??:0
|
打出来的位置信息是乱码,这是因为在编译的时候没有加-g
编译与结果3:
1
2
3
4
5
6
7
8
9
10
11
12
13
14
15
| ~/work/test$ gcc test.cc -rdynamic -g -o test3
~/work/test$ ./test3
stackstrace begin:
./test3(_Z16print_stacktracev+0x26) [0x4008e5]
./test3(_Z4fun1v+0x13) [0x4008a7]
./test3(_Z4fun2v+0x9) [0x4008b2]
./test3(_Z4fun3v+0x9) [0x4008bd]
./test3(main+0x9) [0x40088d]
/lib/x86_64-linux-gnu/libc.so.6(__libc_start_main+0xff) [0x7fa9558c1eff]
./test3() [0x4007c9]
~/work/test$ addr2line -a 0x4008a7 -e test3 -f -C
0x00000000004008a7
fun1()
/home/wuzesheng/work/test/test.cc:20
|
看上面的结果,我们不仅得到了调用栈,而且可以得到每个函数的名字,以及被调用的位置,但还是麻烦,可以写个shell或程序来动态解析堆栈信息,然后传入到addr2line一步解析获得所有的结果。
add2line可以一次打印多个 addr2line -a -e cfox -f -C 0x43a416 0x43961e 0x439329
注意:链接的时候使用 -O0,如果用了其他等级,可以导致行数错乱
例子:代码动态执行addr2line
1
2
3
4
5
6
7
8
9
10
11
12
13
14
15
16
17
18
19
20
21
22
23
24
25
26
27
28
29
30
31
32
33
34
35
36
37
38
39
40
41
42
43
44
45
46
47
48
49
50
51
52
53
54
55
56
57
58
59
60
61
62
63
64
65
66
67
68
| #include <execinfo.h>
#include <string.h>
#include <errno.h>
#include <unistd.h>
#include <stdlib.h>
#include <iostream>
#include <zconf.h>
#include "regex"
#include "vector"
std::string getexepath() {
char result[PATH_MAX];
ssize_t count = readlink("/proc/self/exe", result, PATH_MAX);
return std::string(result, (count > 0) ? count : 0);
}
std::string sh(std::string cmd) {
std::array<char, 128> buffer;
std::string result;
std::shared_ptr<FILE> pipe(popen(cmd.c_str(), "r"), pclose);
if (!pipe) throw std::runtime_error("popen() failed!");
while (!feof(pipe.get())) {
if (fgets(buffer.data(), 128, pipe.get()) != nullptr) {
result += buffer.data();
}
}
return result;
}
void print_backtrace(void) {
void *bt[1024];
int bt_size;
char **bt_syms;
int i;
bt_size = backtrace(bt, 1024);
bt_syms = backtrace_symbols(bt, bt_size);
std::regex re("\\[(.+)\\]");
auto exec_path = getexepath();
std::string addrs = "";
for (i = 1; i < bt_size; i++) {
std::string sym = bt_syms[i];
std::smatch ms;
if (std::regex_search(sym, ms, re)) {
std::string m = ms[1];
addrs += " " + m;
}
}
exec_path = "./main";
auto r = sh("addr2line -e " + exec_path + " -f -C " + addrs);
std::cout << r << std::endl;
std::cout << exec_path << std::endl;
std::cout << addrs << std::endl;
free(bt_syms);
}
void test_m() {
print_backtrace();
}
int main() {
test_m();
return 0;
}
|